DOES Logo Graphic

Iteration Progress Window

The Iteration Progress Window is presented in response to the following action:

Iteration Progress Window Graphic

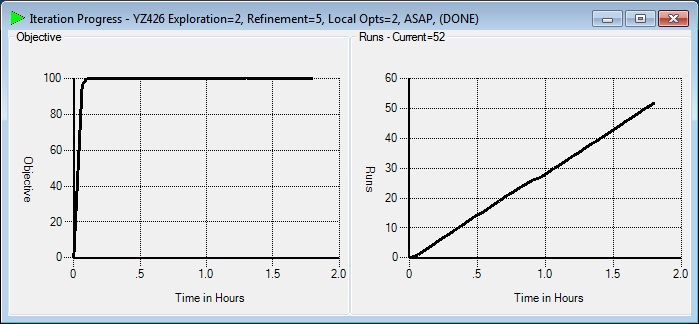
The Iteration Progress window displays an Objective graph and a Runs graph.

Objective Graph

The Objective graph plots the global optimum objective value against time.

Runs Graph

The Runs graph plots the number of runs submitted against time.

DOES has been developed by OPTIMUM Power Technology. For more information, contact:
500 Millers Run Road  •  P.O. Box 509   •  Morgan, PA 15064   •  Phone: 412-257-9070   •  Fax: 412-257-9011   •  sales@optimum-power.com